The Data Triangulation Challenge: Robert Davidson
Robert Davidson, Head of Individual Needs and Data Management, German Swiss International School, Hong Kong
Published
The recent Global Assessment Conference featured a variety of webinars covering a wide array of topics intended to support deeper understanding and leveraging of data from GL Education in the areas of student achievement, aptitude, and attitudes.
In order to support educators with one of the measures in the suite of GL Education tests in particular, the Pupil Attitudes to Self and School survey (PASS), educator and testing ‘guru’, Matthew Savage, hosted a two-part session, Let’s Tessellate. With the intended goal of aiding schools in their journey towards maximising data gleaned from student survey results to ‘triangulate’ with attainment and aptitude data, participants were asked to submit cases for study.
The challenge set was to, ‘think of an aspect of student achievement or wellbeing which you believe to be especially significant in your school… analyse a selection of data related to this issue and identify the main flags or messages from this data’.
Finally, participants were to choose at least one strategy to explore/implement in response to the story the data is telling.
Our situation: a focus on wellbeing
With extended periods of pandemic-related school closure, along with a dearth of both up-to-date wellbeing and achievement data, our priorities in the new school year in September included gaining a better overall picture of how our students (Year 2 to Year 6) were feeling about themselves as learners and about their overall school experience.
As we use the Cognitive Abilities Test (CAT4) in conjunction with the PT Series tests, the New Group Reading Test (NGRT) and the New Group Spelling Test (NGST) measures to better understand aptitude and achievement, PASS implementation was a ‘missing ingredient’ that we now conduct twice a year.
In closer analysis of our September PASS results, what became apparent was that despite a large segment of our students having both aptitude and achievement scores in the 90th+ percentiles, their PASS results indicated scores well below 50% in PASS factor 2: Perceived Learning Capability (a snapshot of a learner’s unfolding impressions of self-efficacy… and can reveal early warning signs of demoralisation and disaffection), as well as PASS factor 7: Confidence in Learning (identifies pupils’ ability to persevere when faced with a challenge. Does a pupil see themselves as giving up at the first hurdle or do they see themselves as having the ability to carry on?)
In staff meetings and PASS related professional development sessions, the initial impressions from the data that scores in these factors were low for some pupils was of little surprise to many teachers, however, that they were low for a large number of our high achievers provided a significant shock. Recollections, both classroom and ‘specialist/subject’ based, included numerous anecdotes of students from across the department displaying signs of what these caring and perceptive educators characterised as, ‘frequently seeking reassurance they were completing work correctly’, or more colloquially as, ‘being very needy in tasks both routine and academic’. The PASS results, generated on class, cohort, and departmental levels, served to move us past staffroom ‘watercooler conjecture,’ onto more solid ground to pinpoint specific areas (or ‘flags’) to further investigate:
Our Response to the Challenge
- To ‘delve deeper’ into the data and to create accompanying graphs that would present a clearer picture of any correlations to confirm initial observations and to make this more easily understood by teachers;
- To involve class teachers, school counsellors, and the entire ‘Team Around the Student’ to work with the PASS results, interventions and other materials to ultimately improve the students’ sense of self-efficacy.
- To help the teachers (and the students themselves) better understand why it is that these pupils are not feeling ‘effective’ in their learning at this time.
Guiding Questions:
What does our data reveal about ‘At-risk’ students? Should we view these students as ‘Fragile Learners’? And if so, what are our next steps to ameliorate?
From the aptitude and achievement data, and well-corroborated by both formative and summative class-based assessments/observations, we were confident of long-standing capabilities.
The data
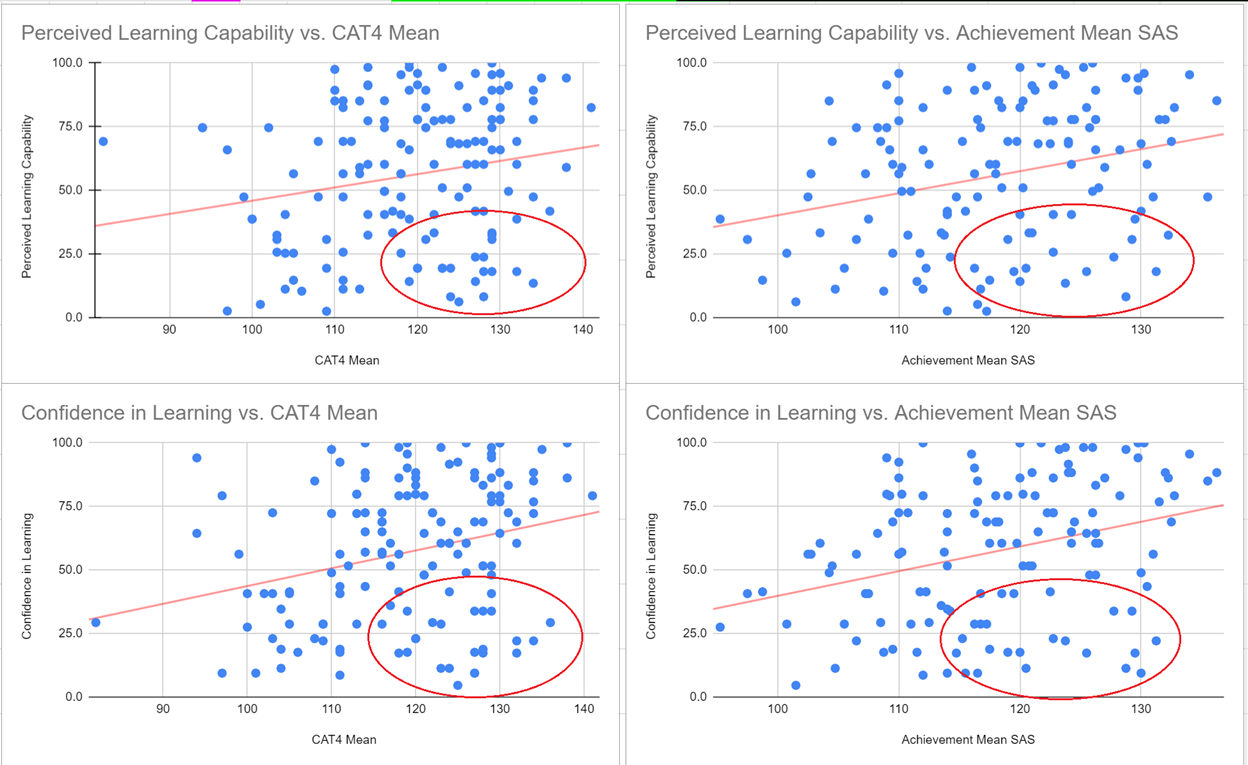
As can be seen from the data chart (Chart 1) below, there are a number of immediately salient features:
- A clearly positive relationship between Perceived Learning Capability (PLC) or Confidence in Learning (CiL) – PASS factors 2 and 7 – and both achievement and aptitude means.
- Highly visible students: Significant numbers of students achieving well, or with high CAT4 means, with accompanying high reported scores in both PASS factors – the upper right ‘Celebrate’ quadrant.
- Highly visible students: A relatively small number of students in bottom left ‘Support’ quadrant with low scores and reported low PASS factors – these students were noted as already receiving support where necessary.
- *At-risk/Fragile Learners – low visibility: Students with high achievement and CAT4 means, yet low reported PLC and CiL scores (circled)

Discussion
As other schools using Data Triangulation to gain a full 360° view of their students have discovered, and perhaps increasingly so with pandemic related closures, we now have clear data to shine a light on ‘at-risk/fragile’ learners.
Matthew’s most important question for me during the webinar was about our prior awareness (lack thereof) for these students. As a staff we sought to ‘zoom in’ on each of these pupils and what predominantly came from those discussions was an element of surprise: we knew they were capable AND achieving, but were not often aware that confidence or self-efficacy was low. What is the state and momentum of their ‘grit and persistence’ with the learning tasks they are encountering each day? Are they receiving – and seeking out – challenge in their daily school lives? We know from the literature that ‘mastery experiences’ along with ‘credible communication and feedback’, are key to building and maintaining self-efficacy. As other educators have pointed out, identification based on reliable data is the first step.
“With fragile learners, we’ve got a group of students that could be completely missed – if teachers aren’t cross-referencing the CAT4 data on those who have potential for high ability with the information from PASS, they might mistakenly assume that the student is doing OK and achieving as expected. But it’s only when you combine the data that you get insights into these groups of students.” Michael Browning, Garden International School (GIS) in Kuala Lumpur
What next?

Originally, the webinar case study was focused on one year group, (although data was analysed on a class and cohort basis). With a very similar and distinct pattern across the Primary years the focus was expanded to encompass the entire Primary cohort who had completed the PASS survey.
With consideration to the PASS Interventions, our next steps focus on improving student self-efficacy through:
- Celebrating achievements, focusing on what we are doing well, recognising students’ efforts, and ensuring that teachers have increased saliency for showing through timely and specific feedback what they value in words and actions. Students given opportunity for peer feedback and self-reflection.
- Counsellors working with students around positive self-talk and dealing positively with stress, and recognising their own emotional state and building vocabulary around it.
- Providing ample opportunity to expand their ‘zone of comfort’– to challenge themselves — alongside reflection about successes when doing so.
- Supporting students, ‘to identify what specific help or support they need to achieve their goals’. PASS Interventions
Finally, as we return once again to a period of Home/Distance Learning, we will continue our discussions at a class and cohort level to ensure that we are focused on student wellbeing during this critical period.


