

“ ”

Triangulating data to optimise insights
Peter Hodge, Principal at the school, has implemented a system whereby their CAT4 data is triangulated with Measuring Academic Progress (MAP) data and internal assessments to gain a deeper insight into student performance by comparing ability and attainment.
Peter explains more: “We use CAT4 as the predictor of what a student is capable of, and how they then should be expected to be performing. The MAP and internal assessment data provides information on the students’ attainment and progress. When we compare these three pieces of data, it allows us to say to teachers – this is what CAT4 shows the students are capable of, this is where their attainment is, if there’s a difference, let’s explore the reasons why. The data encourages educational conversations on how to improve learning.”
Before Peter joined the school, teachers had been struggling to make full use of the data that was generated – laboriously comparing multiple reports. Peter introduced Teacher Data Packs that summarise and compare, class by class, the students’ performance in CAT4, MAP and their internal assessments. Using simple graphs, teachers can now see a visual summary of the relevant CAT4 ability batteries, compared with actual attainment in each area.
“In my previous roles here in Dubai, in Egypt, in the UK and in Australia I have seen how effective use of data has had a positive effect, developing the students, the teachers and the school. It’s reliable information that facilitates those educational conversations.”
Data to support teacher discussions
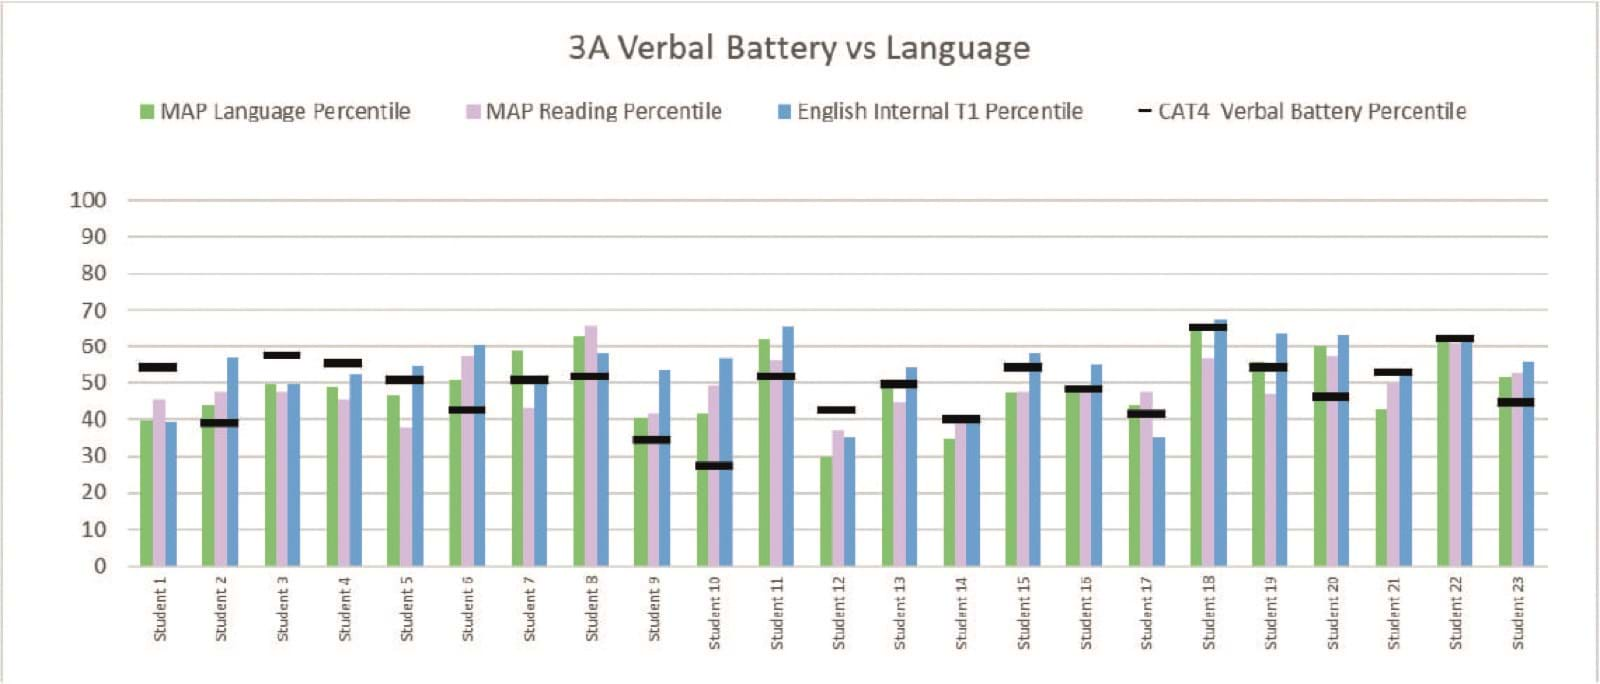
The Teacher Data Packs support the SLT, heads of department, subject heads and teachers in discussing and reviewing student performance. They look at the four CAT4 batteries, comparing them to the students’ MAP scores for language, reading, math and science and internal assessment scores for English, math and science. Table 1 shows an example of this, with the CAT4 verbal battery being compared with MAP Language and MAP Reading as well as the school’s internal assessment for English.
Peter explains the analysis process, “I started off the initial data analysis for one class, then handed it to my data manager to replicate this for an entire grade and then roll out from there to the rest of the school. We used Excel to do this, so there’s no reliance on special programmes.
We originally used percentile scores and have developed the analysis further with more sophisticated methods, but the simple percentile scores are an easily adopted approach for any school to follow. By using this method, we are able to look at not only, for example, a student’s performance in language and reading, but can also confidently compare their performance across subjects as the same criteria have been used each time.”
The bar charts enable the teachers to see, at-a-glance, where a student’s attainment might not be matched by expectations, based on CAT4 – allowing conversations to be started around why this might be.
“ ”
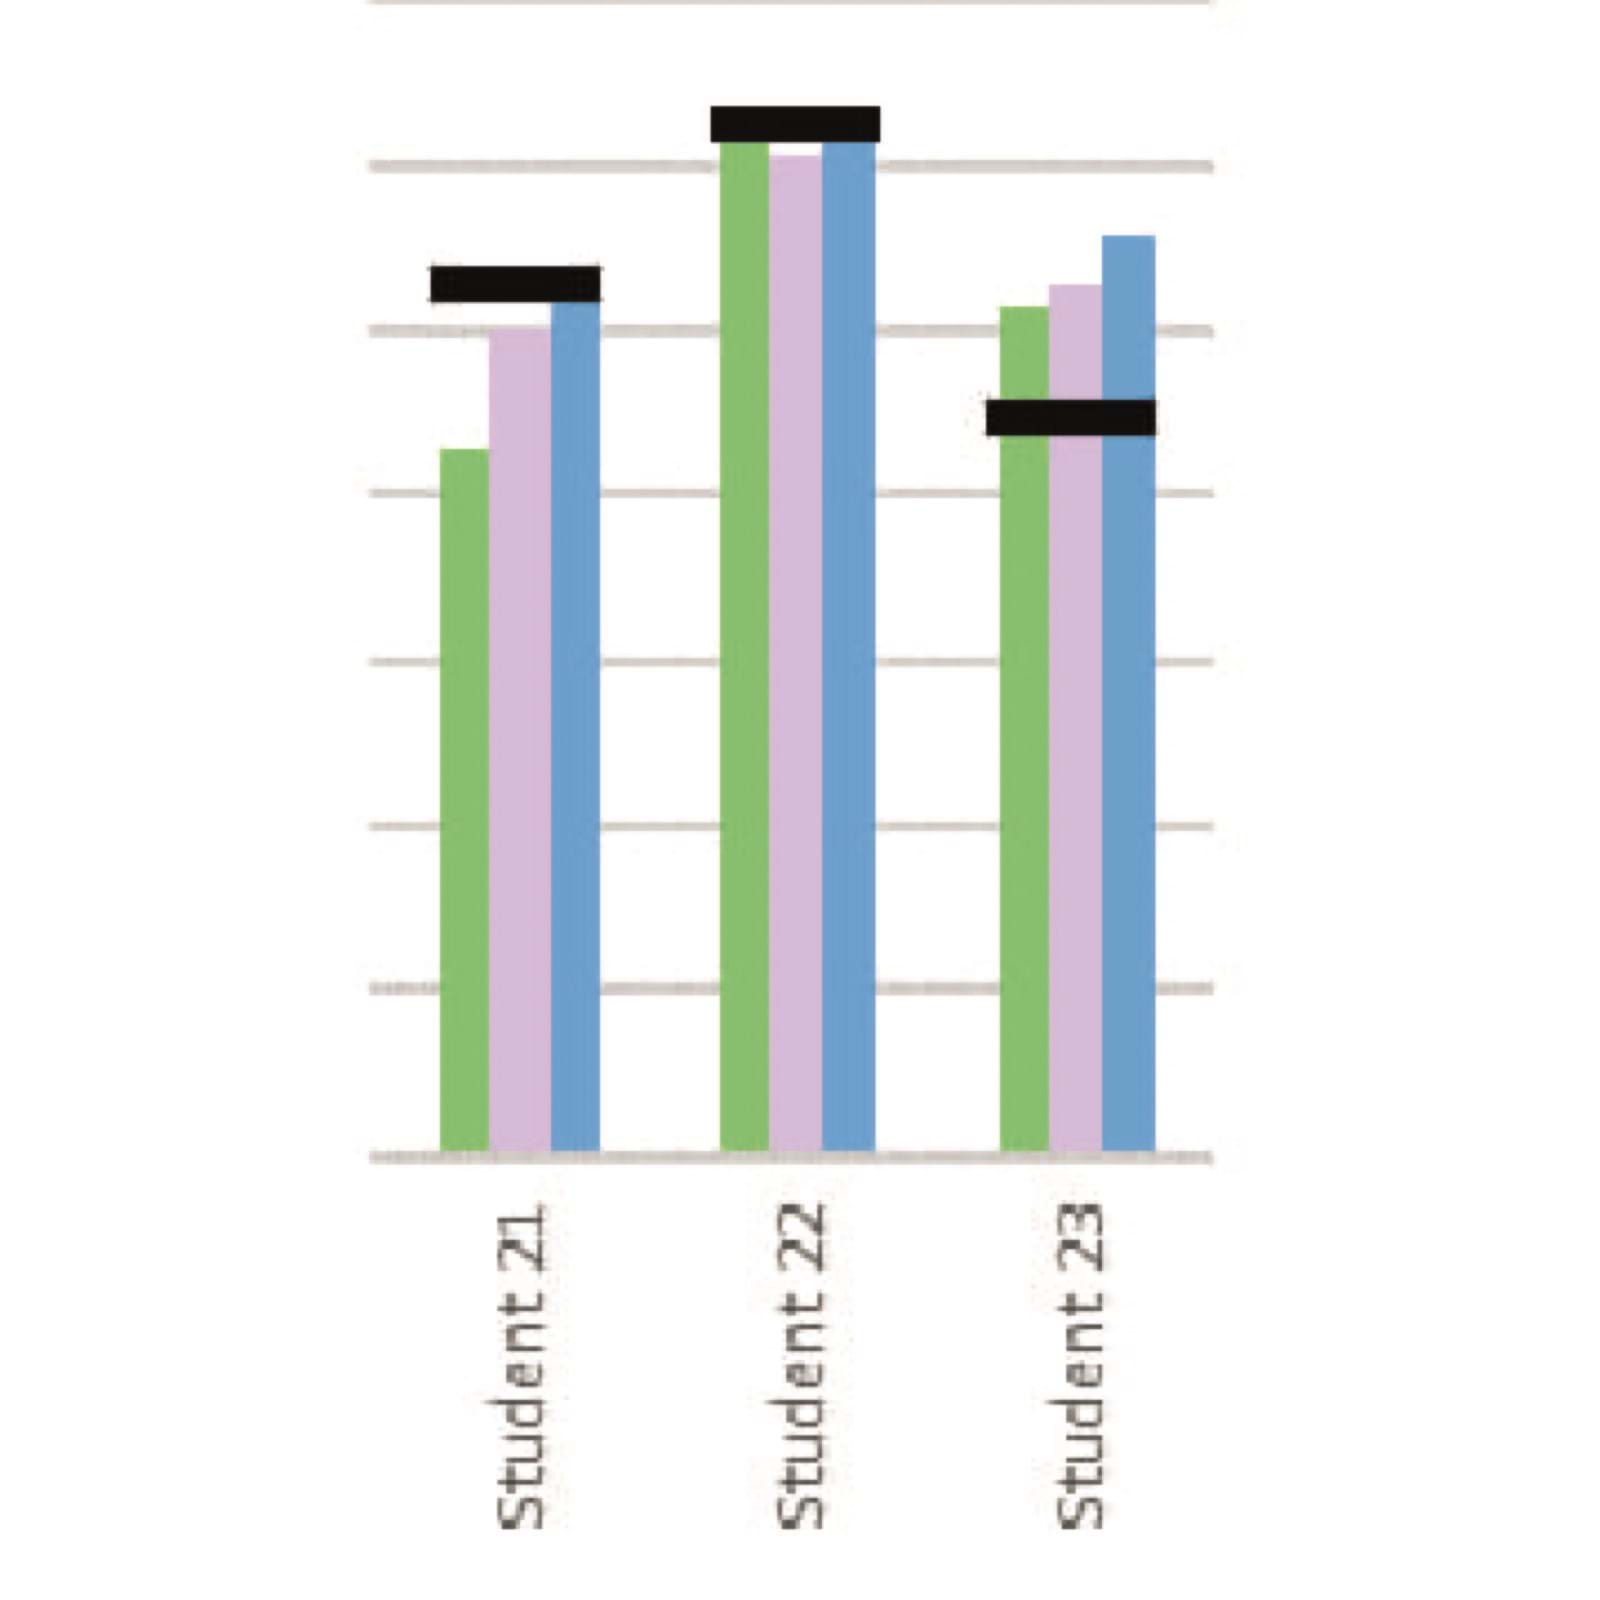
Graph 2

Graph 3
Digging in to the data
When the CAT4, MAP and internal scores are all aligned, this shows that attainment is fully in line with ability (as evidenced by CAT4).
Peter explains: “For example, in graph 2 comparing the CAT4 verbal battery (in black) with MAP language (in green), MAP reading (in pink) and our own internal English assessments (in blue), student 22’s scores are very nearly aligned, showing their performance and ability are in line with expectations.”
When the attainment and ability scores are not aligned, this shows that performance is running either above or below expectations and this is the starting point for further discussions.
Peter explains: “We are looking at the variance – where the student isn’t attaining where they should be. So if the data is showing lower percentiles for MAP and internal assessment, compared to CAT4 (as Students 1 and 3 in graph 3), then we would highlight that, discuss it in teacher sessions and create an action plan.”
We look at interventions and how we can help that student to improve their overall results. Working with heads of department, teachers and with our achievement group (SEN) support teachers we would help develop the student’s knowledge within that particular area of the curriculum.
We could also look at question-level analysis to see how the student has answered MAP questions in certain areas and compare that to the internal testing. We look at whether similar areas of weakness are shown in each, then we can work on these with the student.
Or if they are performing better in internal assessment (as Student 2 here) – is that because the test was too easy and the teacher needs to review that? That’s when you start to look at the historical data to see whether their CAT4 or internal data has changed over time – and that leads to a clear decision basis on what’s happening with that student.”
Sharing the data across the school
The Excel graphs are cut and pasted into a PDF to create the Teacher Data Packs. These are initially shared with the heads of department, grade leaders and subject leads. Any areas of concern are looked at and in-school variances can be identified. Both academic and pastoral areas are reviewed.
The teachers then review the data, department by department. Peter explains more: “When we began using the Teacher Data Packs, I sat in with the heads of department and the department teachers as they talked about and looked at the data – to make sure that they understood the information and could use it effectively.
We then have a ‘show and tell’ type discussion, where we get the whole team together in a bigger room with a screen. These sessions are very open and allow staff to see how a given student is doing in their subject, compared to how they’re doing in other subjects – with discussion of why there may be differences. This group discussion format makes this a sharing experience, rather than looking at the data in a 1:1 setting between a teacher and department head, where some teachers may get defensive. We look at those students where there are variances – where perhaps the CAT4 and MAP data points are saying that the student can do well, but the internal tests are not. We can then review and discuss what actions can be taken.
The heads of department then write up an action plan, summarising what the teachers have said they will do, based on the data. This is consolidated and sent to heads of school who review it overall. We follow this through and monitor that students are being encouraged and developed in the ways that have been planned.”

The impact
This system has only been in place for a short while at Diyar school, but as Peter explains, he’s seen the positive impact of effective use of data elsewhere: “We’re still in the initial phases here at Diyar, but with previous schools I’ve been in, I’ve seen the big impact it can have, not only on how teachers interact with the students but also on how they develop their own internal assessments and testing structure. They produce questions that are more reliable, they talk to other teachers about the questions to ask, so there’s more conversations within the staffroom and teacher groups about how they’re testing.”
And at a higher level, the data is used for planning, assessing training requirements and progressing teacher development with CPD and sharing best practice.
Peter concludes: “Discussions are now happening at all levels between teachers and leadership. They all like the clear, unambiguous information and can see changes in the students and the way they learn.”
