“ ”
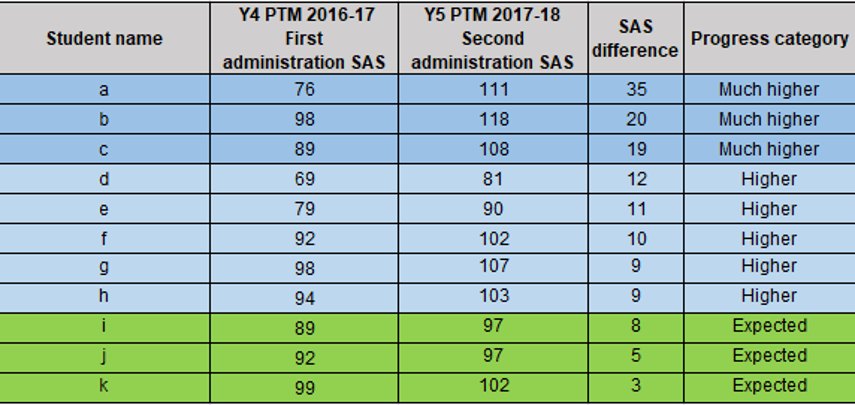
Comparing Progress Test scores year on year provides the school with a benchmarked measure of progress for each student.
Building a complete picture of every child
The school began using GL Education’s Progress Test Series (PT Series) in 2016.
Roopshree Chauhan Marwah, Assessment Co-ordinator at the school, explains more: “We use the PT Series at the end of each academic year – online for Years 3, 4, 5 and 6 and paper-based for Years 1 and 2. We review the data and use it as a baseline when the children move up to the next year group. Their new teachers have the children with them for around a month before we run class review meetings. They are able to triangulate the PT Series data with their own classroom observations and children’s work, as well as attendance and medical records, to build a rounded picture and identify if there are any red flags. We identify any children who either need extra support or extension, and then work out a progress path for each child.”
The data came into its own in the second year of use, when the team could clearly see whether progress had been made – or where students had perhaps slipped back. Melisha explains, “The data allowed us to see issues that we weren’t even thinking of – we were able to ask, ‘Why has this child slipped back’, then we could look at the wider picture and see, for example, that the child had 70% attendance. It meant that we were able to identify issues of attendance and punctuality and were able to put in programmes of support for that.”
Roopshree goes on: “The PT Series data helps us to develop a complete picture of every child – and steers personalised learning. We’re able to see progress across the year, rates of progress, and what the impact of new interventions are. It also gives us the opportunity to base our discussions around the data – providing concrete evidence and equipping teachers with more understanding of the students.“
Encouraging teachers to engage with data
The senior team put in place a system of structured training for the staff, to ensure that they were making the most of the data that was being generated.
Roopshree explains: “Data can be daunting, but this gave us the opportunity to spread assessment literacy amongst the staff, encouraging them to look at data and really use it in their class. We gave teachers the tools to read the data and showed them how to use it to make their teaching more impactful and how to use it to enhance learning.
Before the class review meetings, the Primary Leadership Team (PLT) walked the teachers through how to conduct a class review. We had one-to-one sessions where we took them step-by-step through what the data could show – looking at, for example, the children that had made the least progress that year, rather than just the raw scores in a ranking. It opened their eyes to how powerful that could be. The teachers this year now can’t wait to get their hands on the data – and they’ll be able to unpick it and show us that they can use the data more effectively.”
“ ”

Using data to show the impact of new resources and interventions
Using Progress Test in Maths data, the school identified that, although the children were very capable, the progress rates weren’t where they should be, and potential wasn’t being maximised.
Melisha explains: “We were able to analyse the data and see where changes might need to be made. In Maths, we felt that we could benefit from a mastery programme and have just started using a new mastery resource. It’ll be interesting next year to be able to see what the progress rates in Maths are, so that we can gauge the impact.
We also introduced a new reading programme lower down the school, as we have lots of English as an Additional Language (EAL) learners. That’s been shown by the data to have had a significant impact. It’s been running for around 18 months now and the data demonstrates the impact and effectiveness of it. By the end of Year 1, every child is reading.”
Having a whole-school impact
The school also looked at the more able and wanted to increase the number of students working at greater depth in English. These were identified as students achieving a Standard Age Score (SAS) of 105 and above in Progress Test in English. Following whole school professional development, the numbers rose from 27% of students achieving SAS 105 or above at the end of 2016-17, to 41% at the end of 2017-18.
Melisha explains: “The data showed that the slowest progress was often being made by the highest achievers, so we knew that we needed to challenge the higher level. This was something that we saw throughout the school, so we were able to act quickly. We brought in a trainer from the UK who led some high impact training in reading and writing for the staff. This has had a marked impact and we’ve seen significant progress in the students and in the confidence of the teachers to teach those students too.
Similarly, with supporting our EAL students – we could see that some teachers were struggling. So we got our EAL department to run a series of training sessions, giving the teachers the tools and skills they need.”
Roopshree goes on: “We also encourage teachers to share best practice. From the data we can see which classes are stronger in a particular area. So, for example, if we saw that a class had high scores in one area, we were able to encourage other teachers to go and observe the lessons from that teacher or have a dedicated time where the teachers could share the strategies they employ in their classes with colleagues who would benefit.”